2026/2027


Energy Compensation
Report

Analysis of Compensation Arrangements Among the Largest
U.S. Exploration & Production (E&P) and Oilfield Services
(OFS) Companies, Including Trends in Renewable Energy
and Liquefied Natural Gas (LNG) Compensation

Jump To Section
E&P and OFS Total Direct
Compensation for CEOs and CFOs
Energy Industry
Compensation Overview
Renewable Snapshots
LNG Snapshots

Introduction
DOWNLOAD REPORT

In recent years, stakeholders, regulators, and advisory groups have continued to advocate for more transparency and change with respect to executive compensation. Alvarez & Marsal’s Compensation and Benefits Practice has partnered with ESGauge and is pleased to provide this latest edition of our study on compensation arrangements among the top E&P, OFS, Renewable Energy, and LNG companies in the United States.

2026/2027

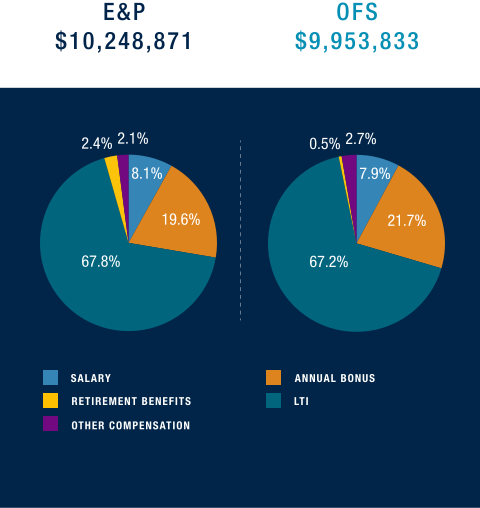
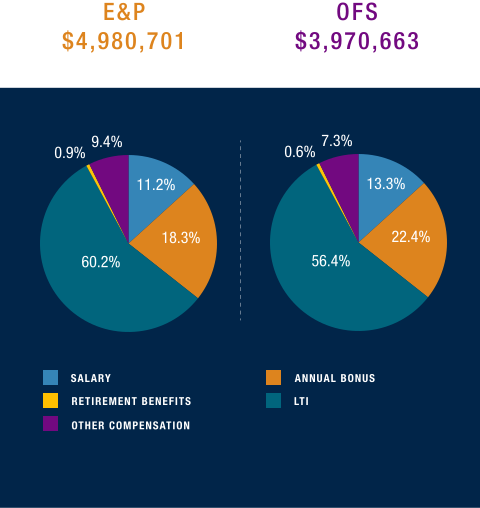
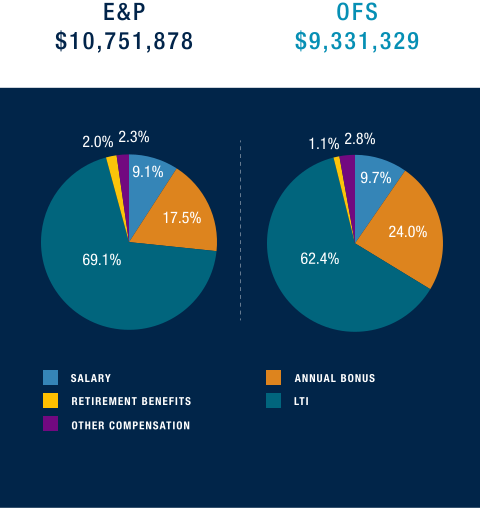
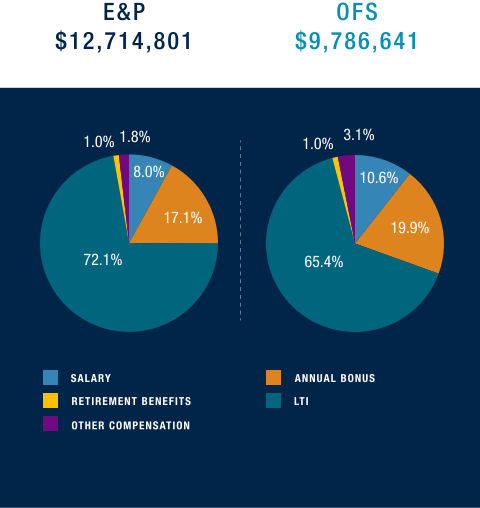
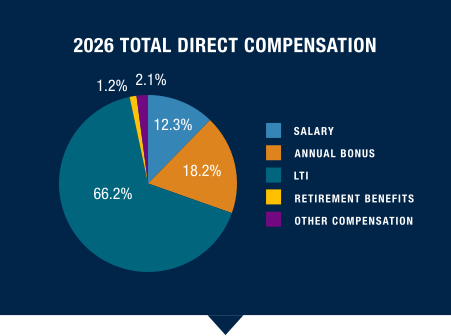
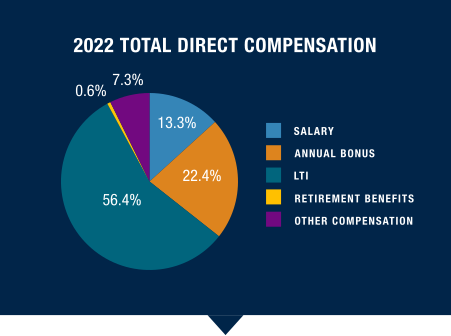
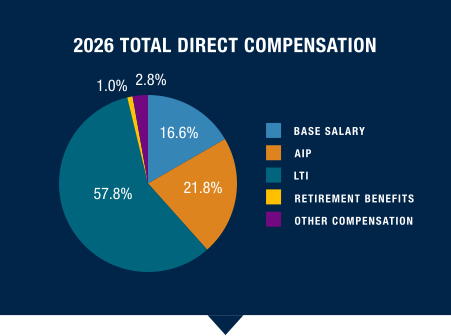
E&P AND OFS TOTAL DIRECT COMPENSATION FOR CEOs AND CFOs

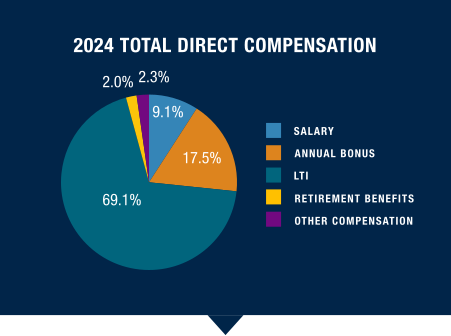
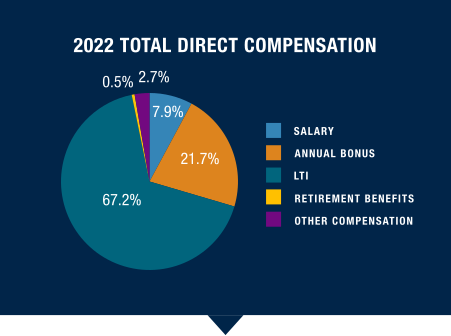
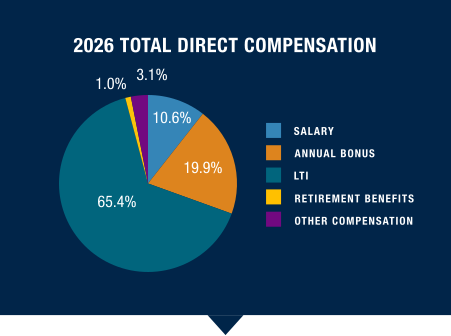
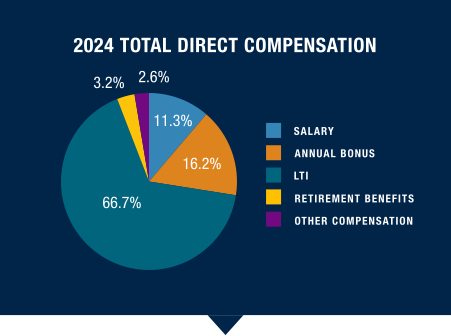
Click on the graph below to explore historical trends in executive compensation at the largest E&P and OFS companies in the United States.

TIMELINE OF CEO AND CFO TOTAL DIRECT COMPENSATION FROM 2022 TO 2026

  • E&P - CEO
  • OFS - CEO
  • E&P - CFO
  • OFS - CFO
$10,248,871
$10,751,878
$12,714,801
$9,953,833
$9,331,329
$9,786,641
$4,980,701
$4,953,311
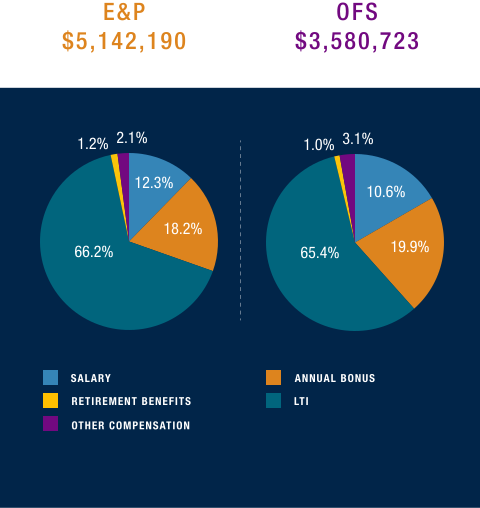
$5,142,190
$3,970,663
$3,217,177
$3,580,723

2026/2027

E&P and OFS
Total Direct
Compensation
for CEOs and CFOs

Click on the graph below to explore historical trends in executive compensation at the largest E&P and OFS companies in the United States.

Timeline of CEO and CFO Energy Benefits 2022 through 2026

CEO
CFO
2022
2024
2026

Energy Industry Compensation Overview

To understand compensation practices in the energy sector, the Compensation and Benefits Practice of Alvarez & Marsal examined the 2026 proxy statements of the largest E&P and OFS companies listed on U.S. based exchanges. Explore some of our key findings below:

2026 Average Base Salary

The average CEO and CFO base salary is relatively consistent between both E&P and OFS companies.

AIP

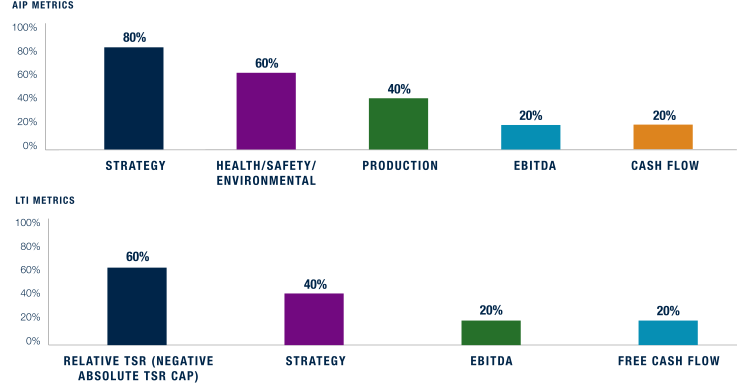
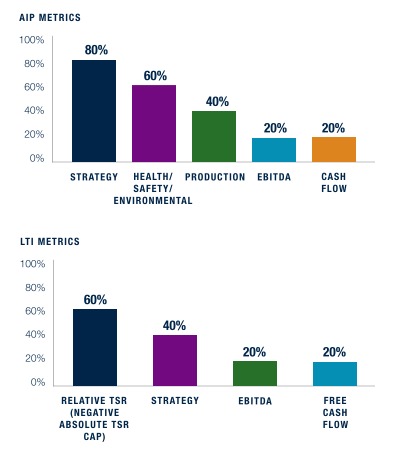
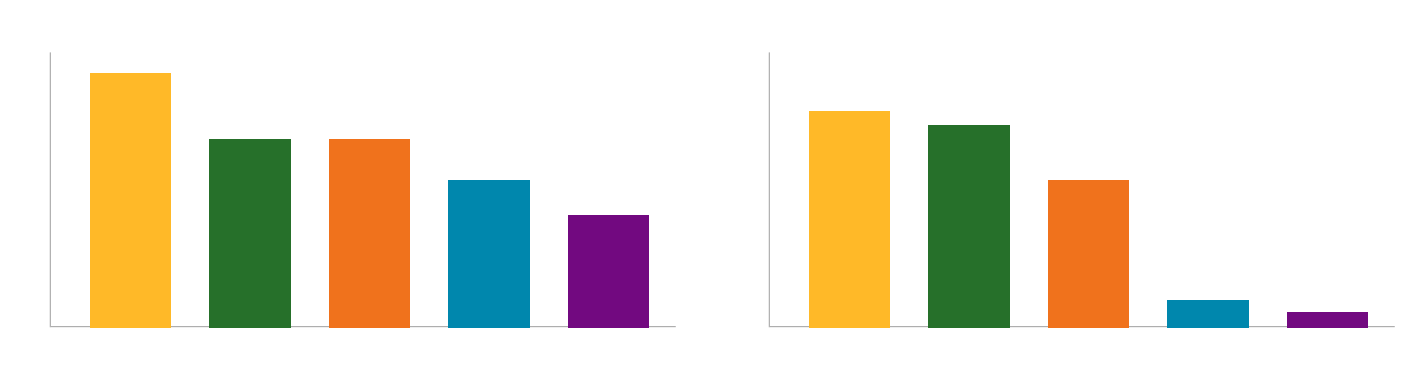
The most common AIP metric is Health/Safety/Environmental at 95% and 80% for E&P and OFS companies, respectively.
LTI

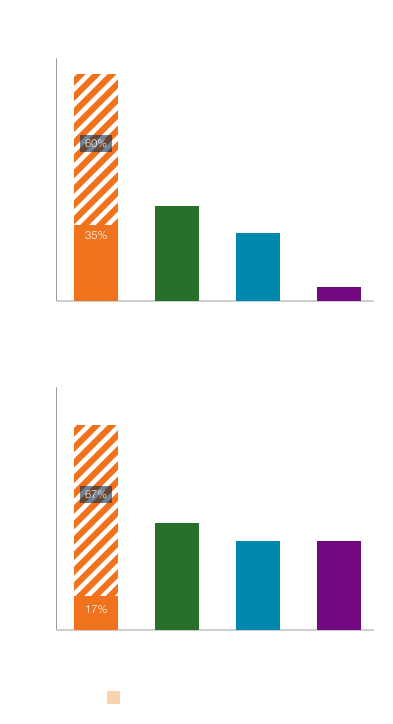
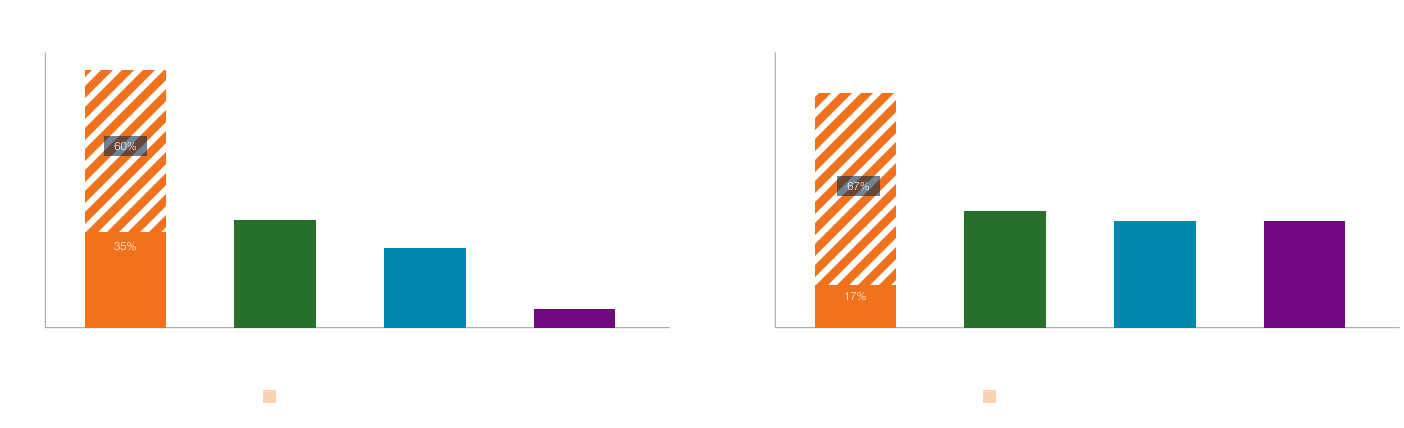
Relative TSR is the most prevalent LTI metric among both E&P and OFS companies, used by 95% and 84% of companies, respectively. Of those companies using Relative TSR, 60% of E&P companies and 67% of OFS companies apply a negative absolute TSR cap (limits the payout of a performance award when a company’s absolute TSR is negative over the performance period, regardless of its relative performance versus peers).
Energy Industry
Compensation
Overview

To understand compensation practices in the energy sector, the Compensation and Benefits Practice of Alvarez & Marsal examined the 2026 proxy statements of the largest E&P and OFS companies listed on U.S. based exchanges. Explore some of our key findings below:


Average Base Salary
AIP Metrics
LTI Metrics

Average Base Salary

The average CEO and CFO base salary is relatively consistent between both E&P and OFS companies.

AIP

The most common AIP metric is Health/Safety/Environmental at 95% and 80% for E&P and OFS companies, respectively.

LTI

Relative TSR is the most prevalent LTI metric among both E&P and OFS companies, used by 95% and 84% of companies, respectively. Of those companies using Relative TSR, 60% of E&P companies and 67% of OFS companies apply a negative absolute TSR cap (limits the payout of a performance award when a company’s absolute TSR is negative over the performance period, regardless of its relative performance versus peers).


Renewable Energy Snapshots

Compensation for Renewable Energy companies can vary widely from the E&P and OFS companies. A&M analyzed compensation data for 5 of the largest Renewable Energy companies, as summarized to the right.
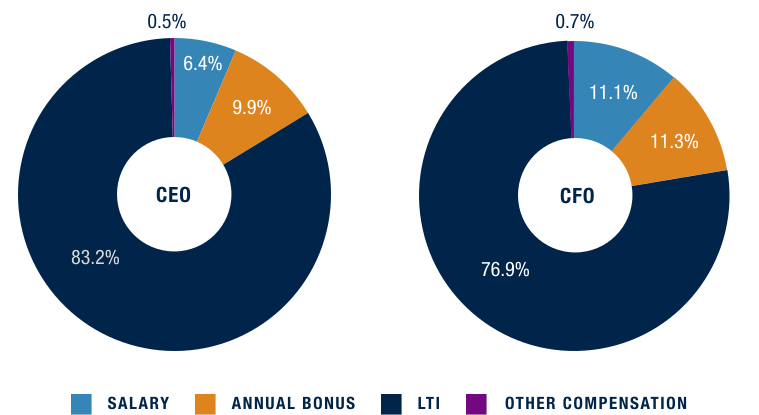
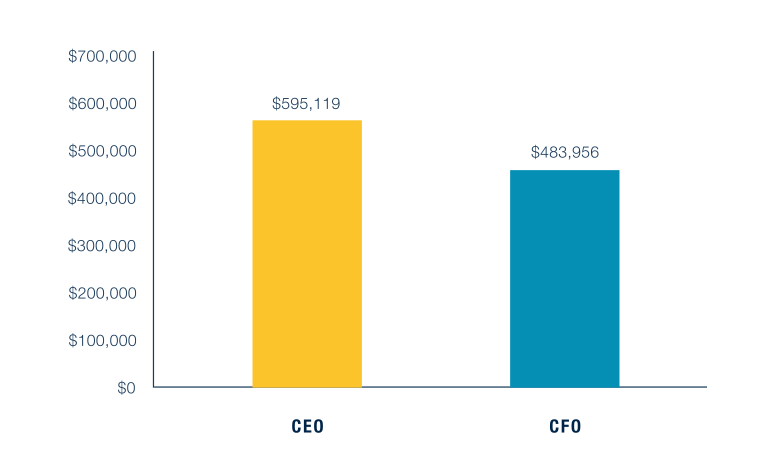
2026 TOTAL DIRECT COMPENSATION FOR CEOs AND CFOs


Average Base Salary


AIP & LTI Metrics


Renewable Energy
Snapshots

Compensation for Renewable Energy companies can vary widely from the E&P and OFS companies. A&M analyzed compensation data for 5 of the largest Renewable Energy companies, as summarized below.
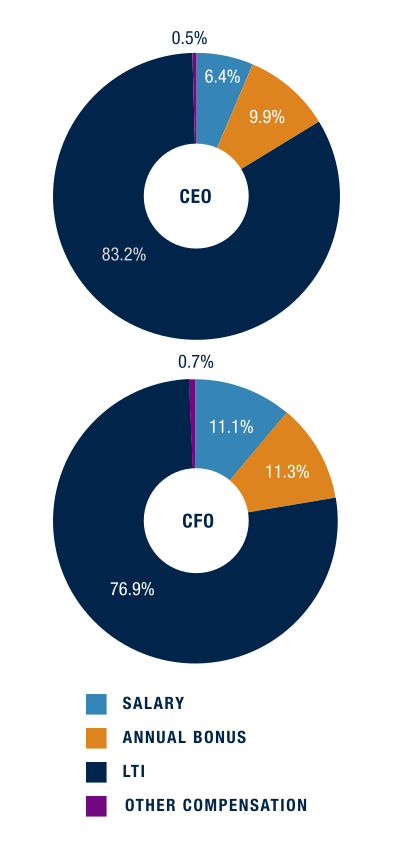
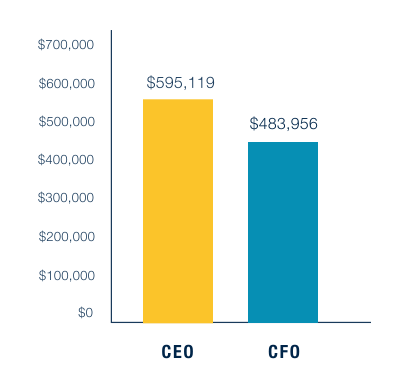
2026 Total Direct
Compensation for CEOs and CFOs
Average Base Salary
AIP & LTI Metrics
`

2026 TOTAL DIRECT COMPENSATION FOR CEOs AND CFOs


Average Base Salary


AIP & LTI Metrics


Effective compensation programs are critical to attract, retain, and drive performance of executives. Companies should ensure that their executive compensation programs are aligned with the market throughout each potential phase of a company’s life cycle, including initial public offering (IPO), transaction/merger, steady state, bankruptcy, and recovery upon emergence.


LNG Snapshots

Compensation for LNG companies can vary widely from the E&P and OFS companies. A&M analyzed compensation data for 5 of the largest LNG companies, as summarized to the left.
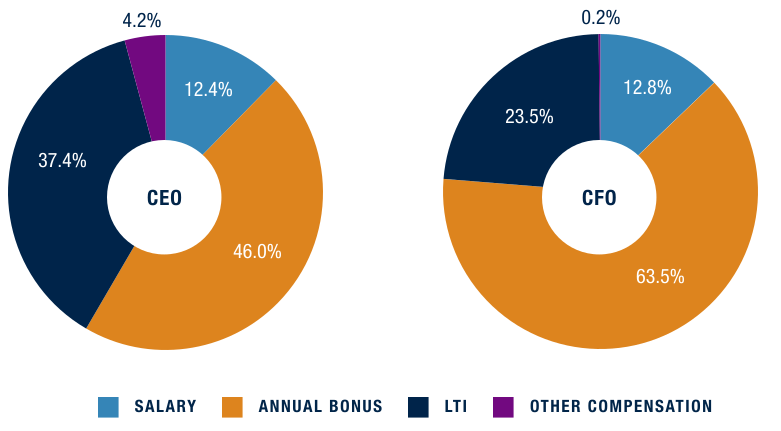
2026 TOTAL DIRECT COMPENSATION FOR CEOs AND CFOs


Average Base Salary


AIP & LTI Metrics


LNG
Snapshots

Compensation for LNG companies can vary widely from the E&P and OFS companies. A&M analyzed compensation data for 5 of the largest LNG companies, as summarized below.
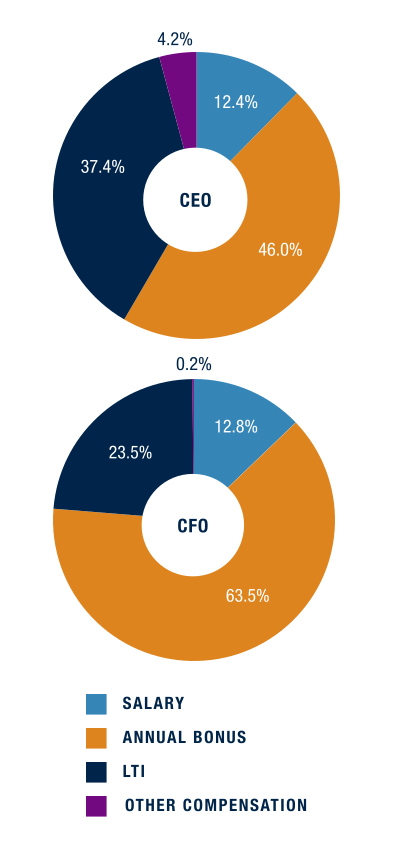
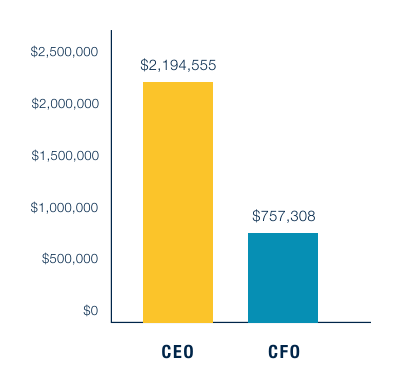
2026 Total Direct
Compensation for CEOs and CFOs
Average Base Salary
AIP & LTI Metrics

2026 TOTAL DIRECT COMPENSATION FOR CEOs AND CFOs


Average Base Salary


AIP & LTI Metrics


The Compensation and Benefits Practice of Alvarez & Marsal assists companies in designing compensation and benefits plans, evaluating and enhancing existing plans, benchmarking compensation, and reviewing programs for compliance with evolving laws and regulations. We provide these services in a manner that helps manage the tax, financial, and regulatory burdens associated with such plans. Through our services, we help companies lower costs, improve performance, strengthen the bottom line, and attract and retain key talent.

Connect With Us

* indicates required fields

This field is for validation purposes and should be left unchanged.
Name